Release 2.5.0 introduces some important improvements to the gene.iobio app. Key among these is the new ‘ClinVar Variants’ panel that shows all known ClinVar variants for a gene. There are also a number of exciting features in this release including gnomAD allele frequencies and advanced variant filtering based on parent and sibling affected status.
ClinVar Variants
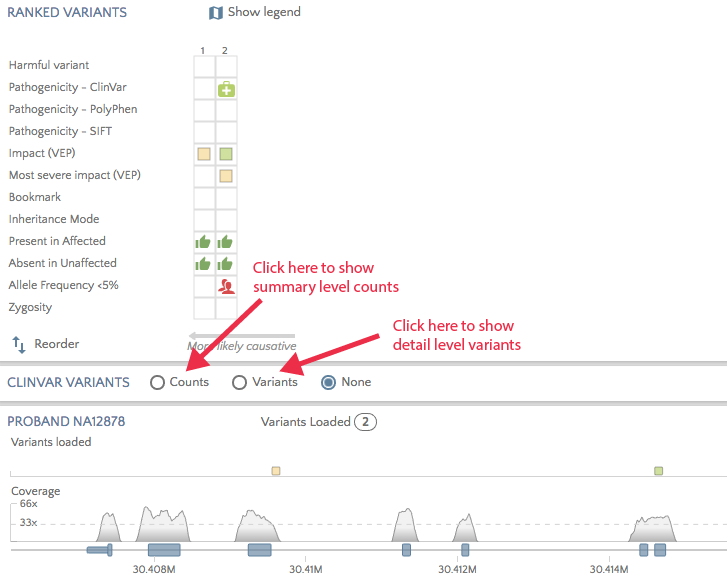
A new panel has been introduced to gene.iobio to show clinically relevant variants known in a gene. The app accesses the weekly refreshed ClinVar variants file to show either summary level variant counts per exon or detail level variants across the gene. Click on one of the radio buttons to display the relevant chart.
There are three ways to view summary variant counts across the gene. The ‘exon chart’ shows ClinVar variant counts categorized as pathogenic, benign, other, and unknown, summarized per exon. Here we show the ClinVar counts for gene PDHA1, which have the most ClinVar variants in exon 11 and 12.
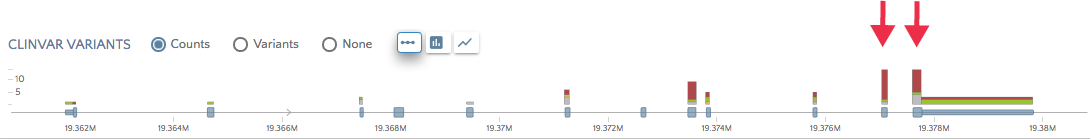
You can also switch to a bar chart or or area chart views to see the distribution of variant across the entire gene.


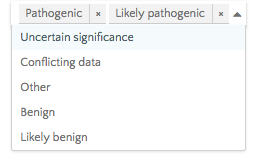
Click on the ‘Variants’ radio button to view all pathogenic and likely pathogenic variants for the selected gene. Hover over or click on variants to see the phenotype/disorder associated with this variant. This can be useful when a variant of unknown significance appears for the proband and you would like to ascertain if other variants in the same region have been associated with the proband’s phenotype(s).
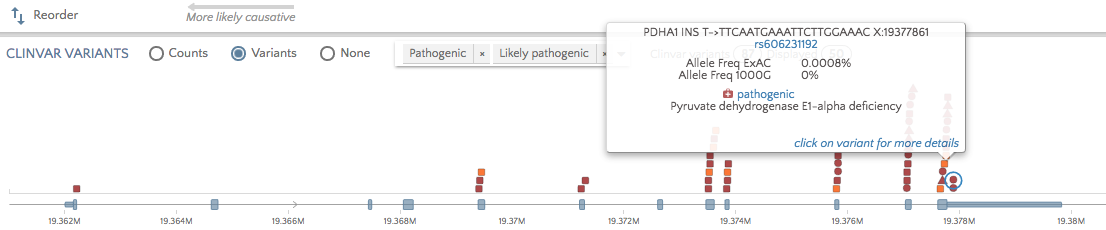
To view non-pathogenic variants, click on the dropdown to select other categories.
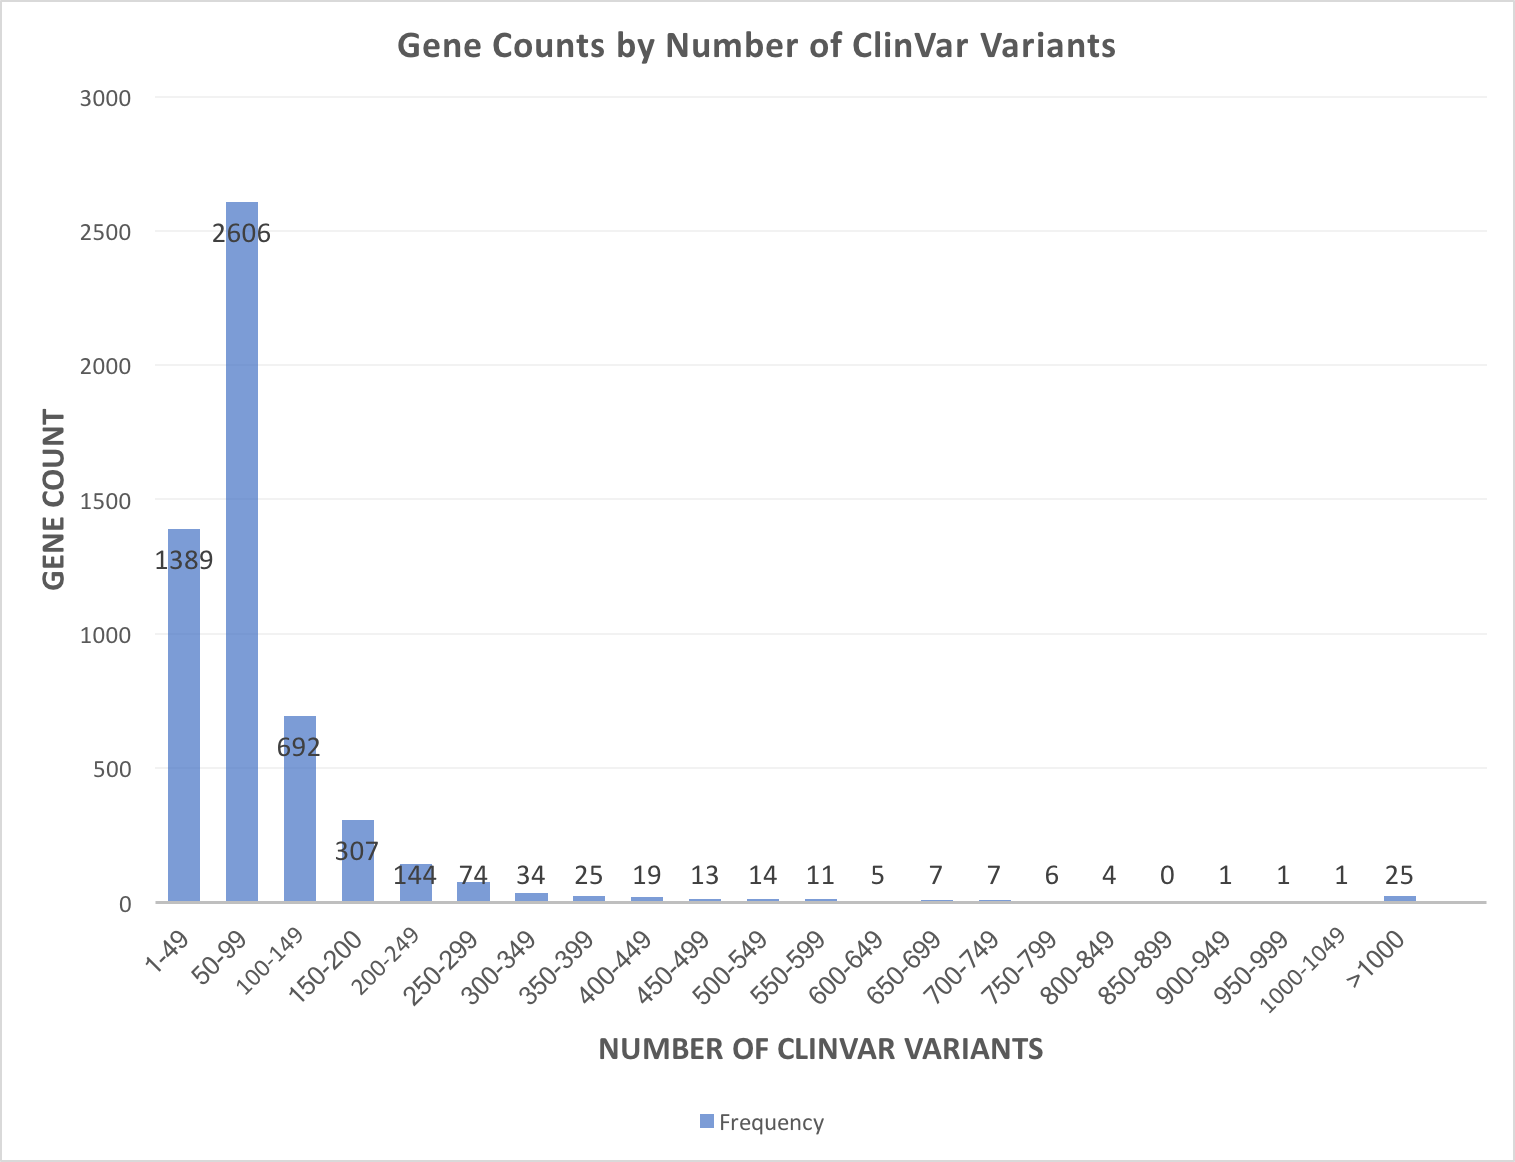
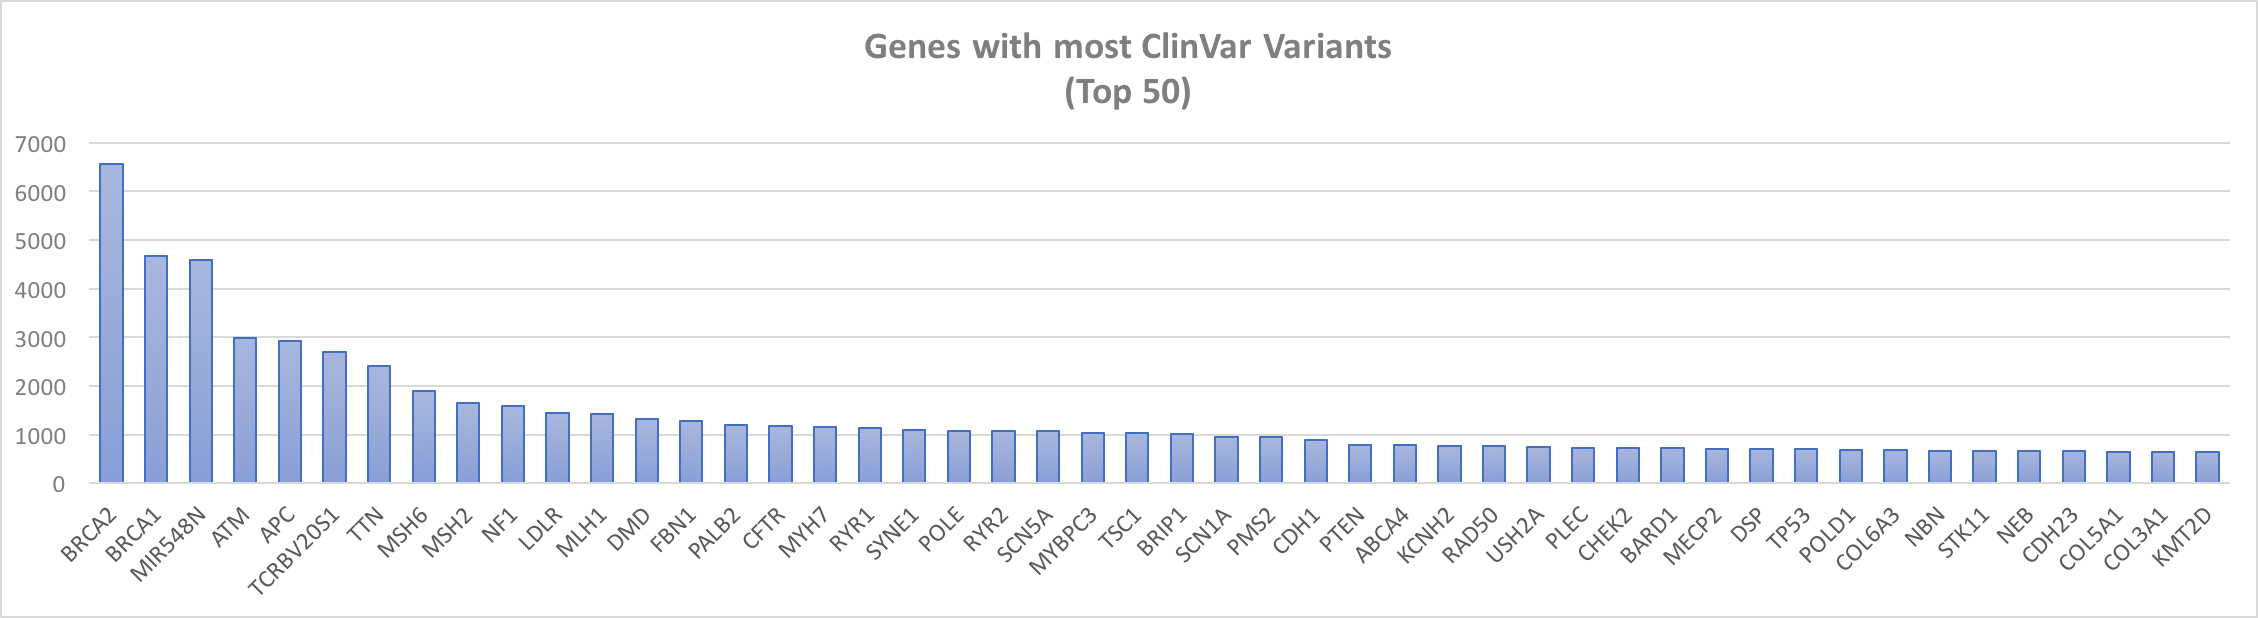
By default, the app filters by pathogenic and likely pathogenic ClinVar variants because, as the figure below illustrates, a few genes have thousands variants in ClinVar. Most genes have under 200 ClinVar variants, which is well within the range of displaying in gene.iobio.
gnomAD Allele Frequencies
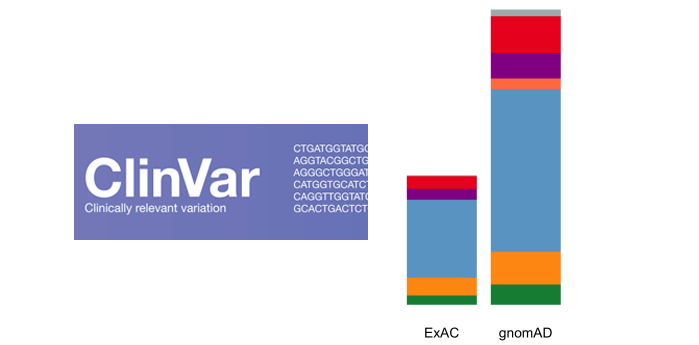
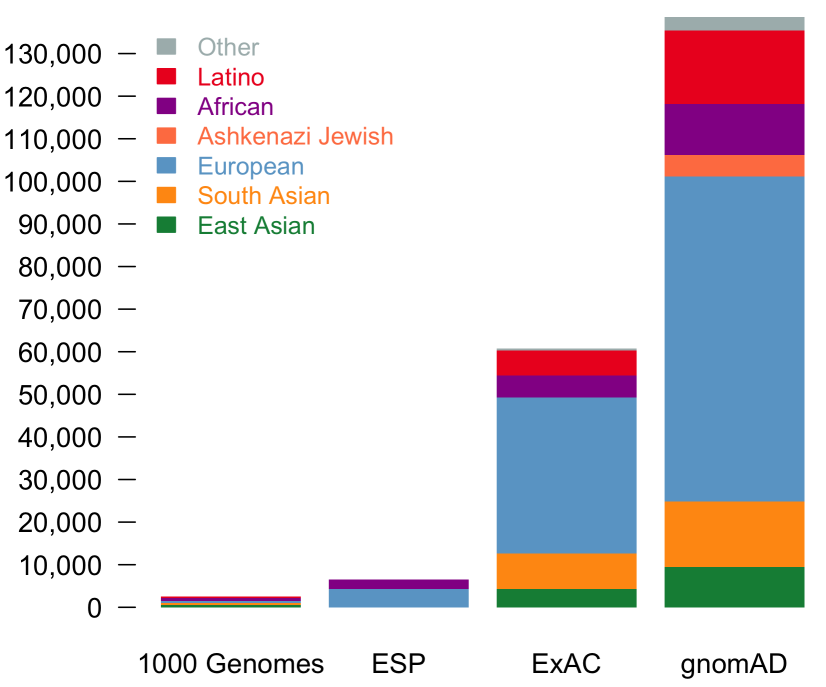
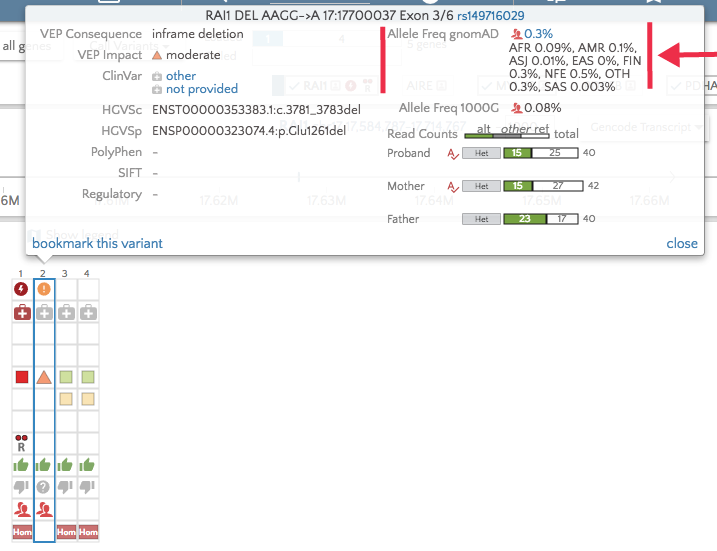
With the upgrade to VEP version 90, gene.iobio is now able to display allele frequencies from gnomAD. These allele frequencies come from exome sequence data from 123,136 individuals and whole genome sequencing from 15,496 individuals. As the figure illustrates below, this represents a much larger sample set.
The overall gnomAD allele frequency as well as those for each population appear in the tooltip in gene.iobio.
Advancing filtering on Affected Status
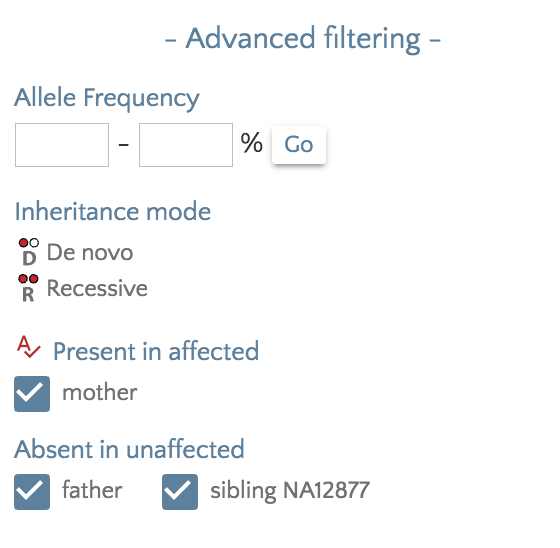
We have added the ability to filter variants according presence in affected samples and absence in unaffected samples. A coming release will expand filtering for autosomal dominant, x-linked, and compound heterozygous inheritance patterns, but with sometimes ambiguous phenotype designations or varied penetrance, a more nuanced filtering is sometimes required.
From the ‘Filter panel’, under ‘Advanced filtering’, checkboxes for affected and unaffected samples will allow fine-grained filtering. For example, checking an unaffected sibling would exclude any variants that exist in an unaffected sibling.
What’s next
Stay tuned! Our next release of gene.iobio will allow a pre-compute step to generate a list of variants across the genome that have a rare allele frequency and a high or moderate impact, allowing genome-wide variant analysis in cases where a well-defined gene list is either not available or does not reveal any candidate variants.