A new version of gene.iobio is up, and this one has a really big feature addition that is really powerful. This update will help identify possible false negative calls due to data insufficiency, and is extremely important in any diagnostic analysis.
Updates to the user interface
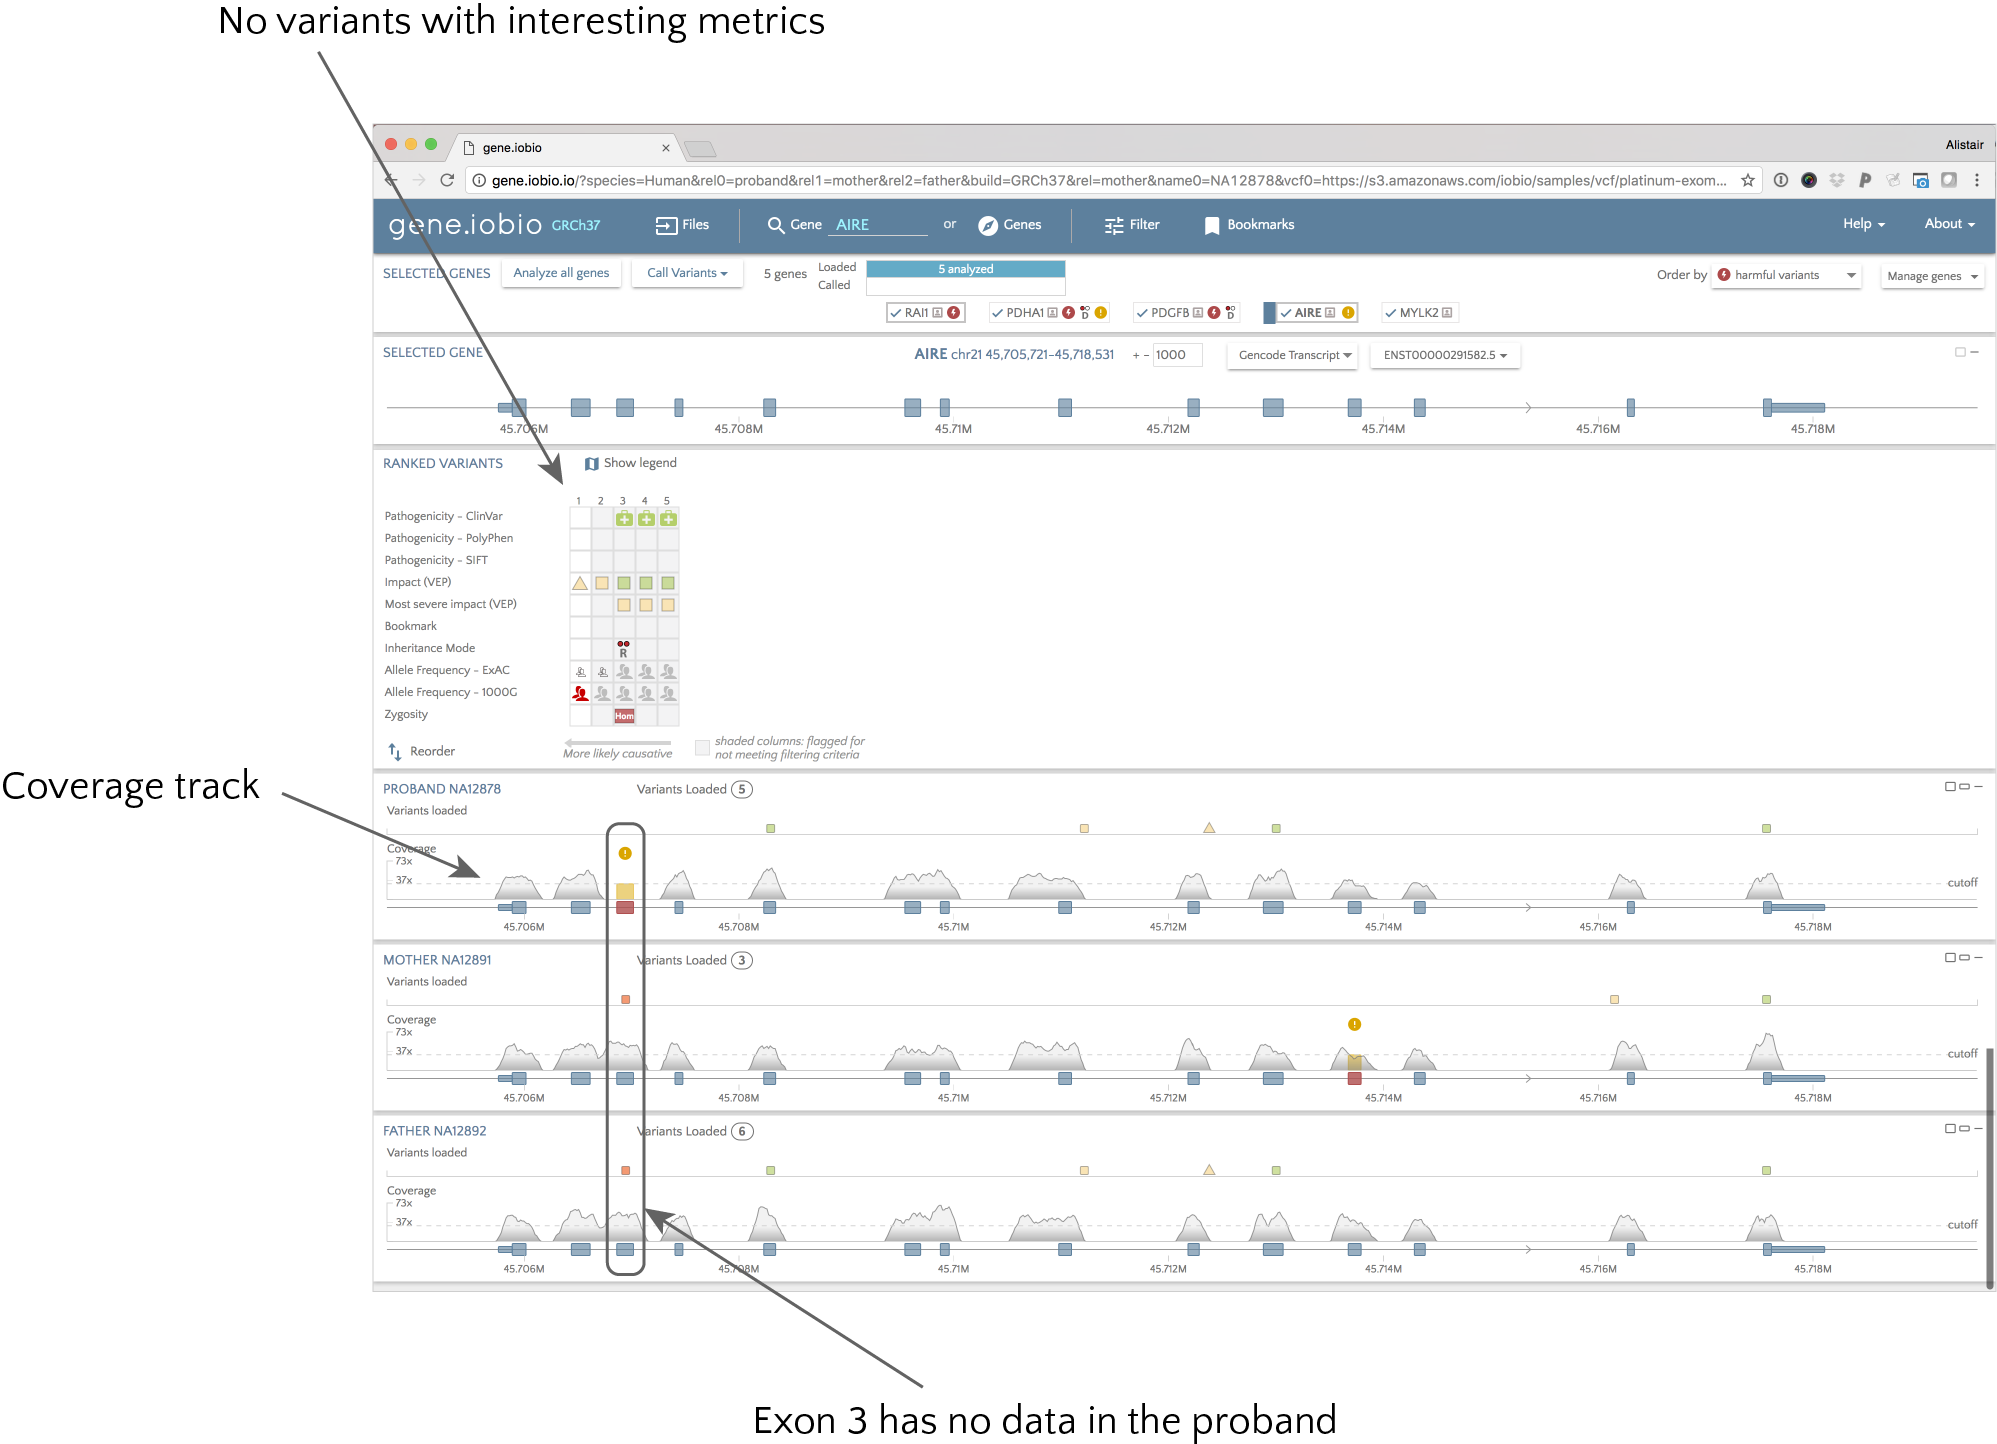
The best way to see the power of this update is through an example, so we will use the demo dataset so that you can follow along. Imagine that we have a patient suffering from autoimmune polyendocrinopathy-candidiasis-ectodermal dystrophy (APECED). We know that mutations in the AIRE gene can be associated with this disorder, so we are using gene.iobio to check for any mutations. The dataset we are looking at is modified public data, not a real patient, but in this example, we see no variants in the AIRE gene that stand out as interesting (e.g. no annotations suggesting likely pathogenicity). We might be tempted to move on and look at other genes, but before we do, let’s take a closer look at the coverage for the proband.

The coverage track shows how the coverage varies across the gene for each sample. We can see that this is exome sequencing as we only see coverage across the exons, and nothing in the intronic regions. One thing stands out for the proband though. Exon 3 appears coloured in red in the gene model, and has a warning symbol to alert you to the fact that the coverage in this exon fails the default parameters for defining a “passing” exon. Hovering over the exon shows the coverage metrics (mean, median, min, max, etc.) for the exon, as well as which metrics “fail”. In this case, the exon has been completely skipped, so there is zero coverage across the whole exon. This means that no variant caller would be able to identify mutations in this exon, as there is no data - but they would not alert the user to the potential problem. We can see that both parents are hets for a likely pathogenic variant in this exon, so it is possible the child has inherited two bad copies of this gene; but we would never know! In this case, it would be important to resequence this gene in the proband and look for this variant.
Filtering metrics
There are a number of different metrics that are tested to determine if an exon "fails". The user can set the cutoffs for these metrics in the filter panel (5). The values that can be set are:Filtering genes on coverage
It is really important to visualize the coverage problems when looking at a gene, but we need to be sure that you look at all genes that harbour coverage problems. Gene.iobio helps you do this. Again using the demo dataset, we will demonstrate how. Once we open the demo data, we select “Analyze all genes”. In a few seconds, all the gene badges at the top of the page show a summary of each gene.

Both AIRE and PDHA1 badges include a glyph indicating coverage problems ( ), so we know we need to take a look at them. If the gene list is large, rather than looking through all these gene badges, we can apply a filter to identify genes harbouring coverage problems. To do this, we select the “Filter” option (1 in the above figure), and from the side panel, click the “Insufficient coverage in exons” button (2).

The summary (3) shows us that two genes fail this filter, and the gene badges are now sorted to put these genes first (4). In this case, the PDHA1 and AIRE genes are shown first, with the other genes fading into the background. Now we can look at each of these genes in turn to identify what the problems are, and if we think they are a genuine problem that we need to take action on.


