Exome data has unique characteristics, which affects the way the data is checked and analyzed. In this post, we will use exome data from a 1000 Genomes project trio to highlight some iobio features that are particularly useful when analyzing exome data.
The first step in the analysis is to ensure that the data quality is sufficiently high. We use bam.iobio to check the global statistics of the alignment files, which we can view here.
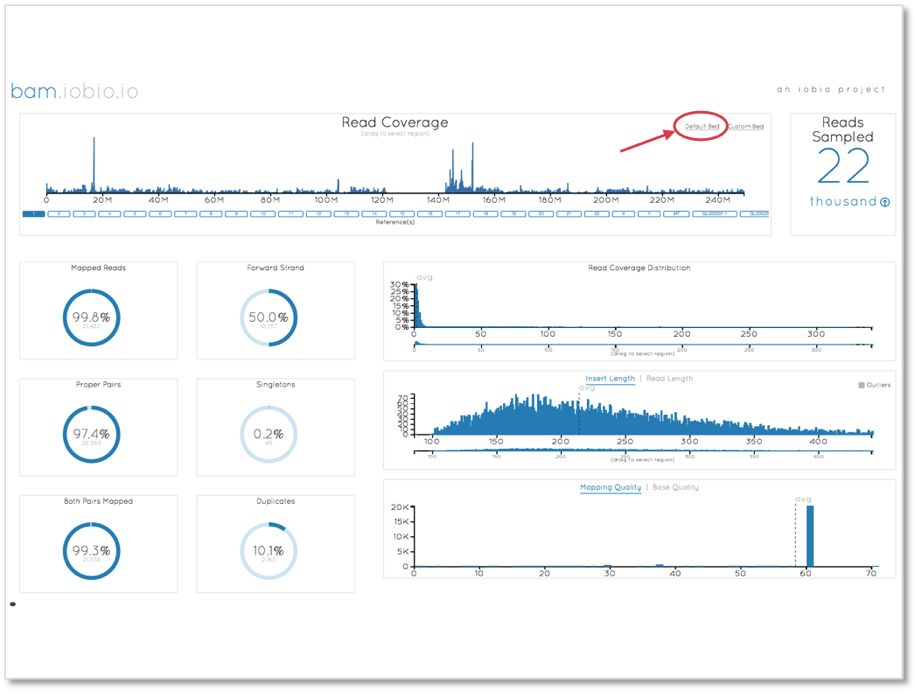
A noticeable problem with this view for exome alignments is that since the majority of the genome has zero coverage, the read coverage chart is dominated by the zero coverage bases. To focus on the exome only, we can select the ‘Default Bed’ option (highlighted in the above plot) to use the 1000 Genomes human exome targets file to focus sampling in these regions.

When only considering the targeted exome, the coverage is encouragingly generally greater than 60X.
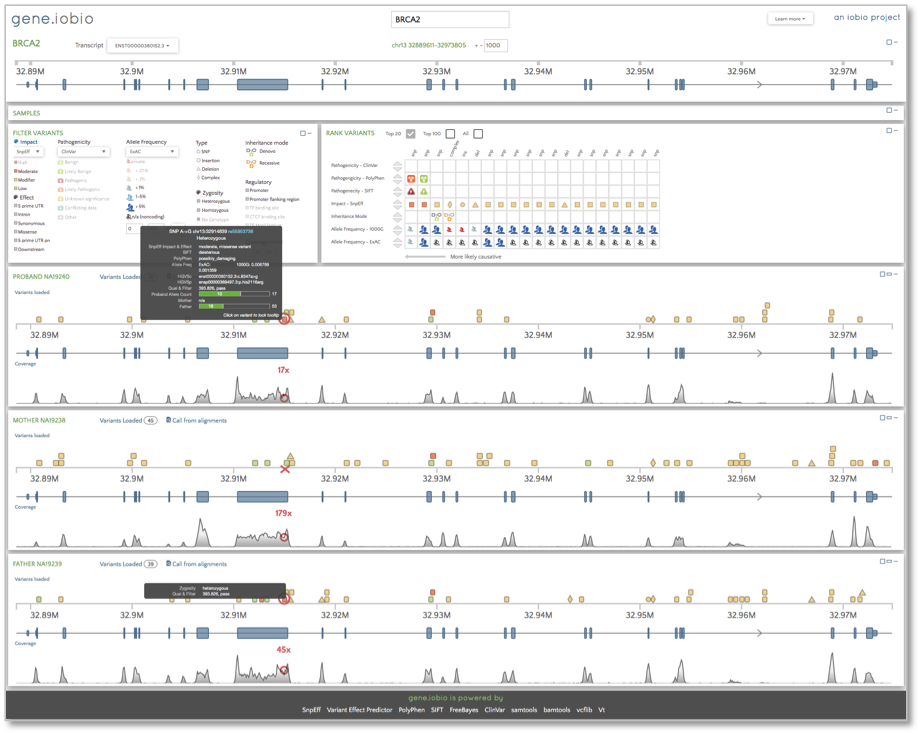
Now, we want to look at the alignments and the variant calls for the trio. We will look at a few different genes, beginning with BRCA2. We know that the 1000 Genomes samples were over 18 years of age and healthy at the time of DNA collection, but we can see that the father is carrying a heterozygous variant identified as possibly damaging by PolyPhen and deleterious by Sift in one of the exons. Snpeff identifies this variant as having a moderate impact and we can also see that the child (identified as the proband in this trio) has inherited this allele from her father. This variant appears as the highest ranked in the ‘Rank Variants’ table.
Now, let’s take a look at the CFTR gene.
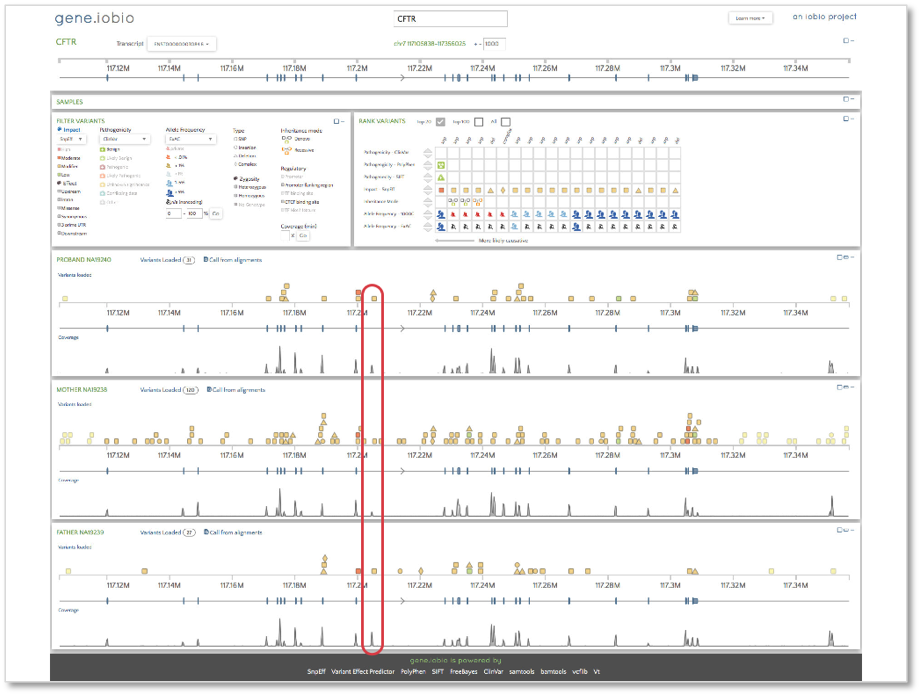
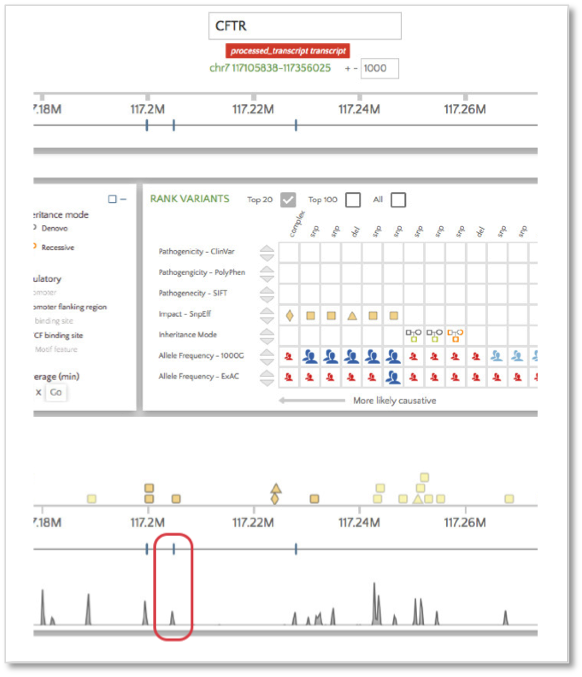
When we open gene.iobio in the CFTR gene, we are presented with the canonical transcript. We can immediately see that there is coverage in all three samples in what appears to be an intronic location. This situation is likely the result of an exon present in an alternative transcript for this gene. To check, we can use the ‘Transcript’ drop-down menu and look at all the other available transcripts. The processed transcript (i.e. a transcript that does not contain an open reading frame) highlighted in the figure below appears to have an exon in the location with coverage.

When selected, we see that this coverage peak indeed fell within this exon.
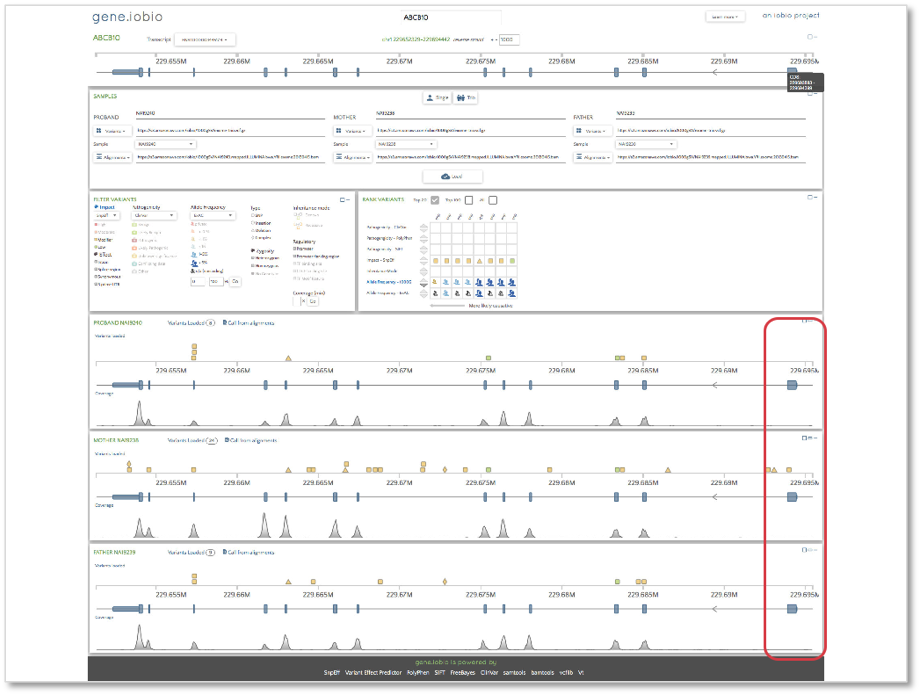
Finally, we will look at the ABCB10 gene. This gene shows the opposite situation to what we observed in the CFTR gene. The final coding sequence (CDS) in the canonical transcript has no coverage in any of the samples. A quick check of the 1000 Genomes project exome targets bed file reveals that this exon is included and so coverage would be expected at this location. If it were the case that any of the samples harbored a deleterious mutation in this CDS, it would not be identified from this sequencing experiment, since no DNA sequence is present within it. This is a known cause of false negative variants, i.e. variants that are not called when they do exist and can quickly and easily be identified within gene.iobio.
