Announcing bam.iobio 2.0!
We’re excited to announce the launch of bam.iobio 2.0. This update represents a major rework of the underlying code of the app, which is now using the Vue.js framework. This new framework gives us much more leverage and flexibility when adding features and fixing bugs.
As part of the update, we’ve also added several new features.
The most important are:
- Added a Get Help page
- Local CRAM support
- Overhauled the read coverage chart
I’ll highlight each of these below.
Get Help page
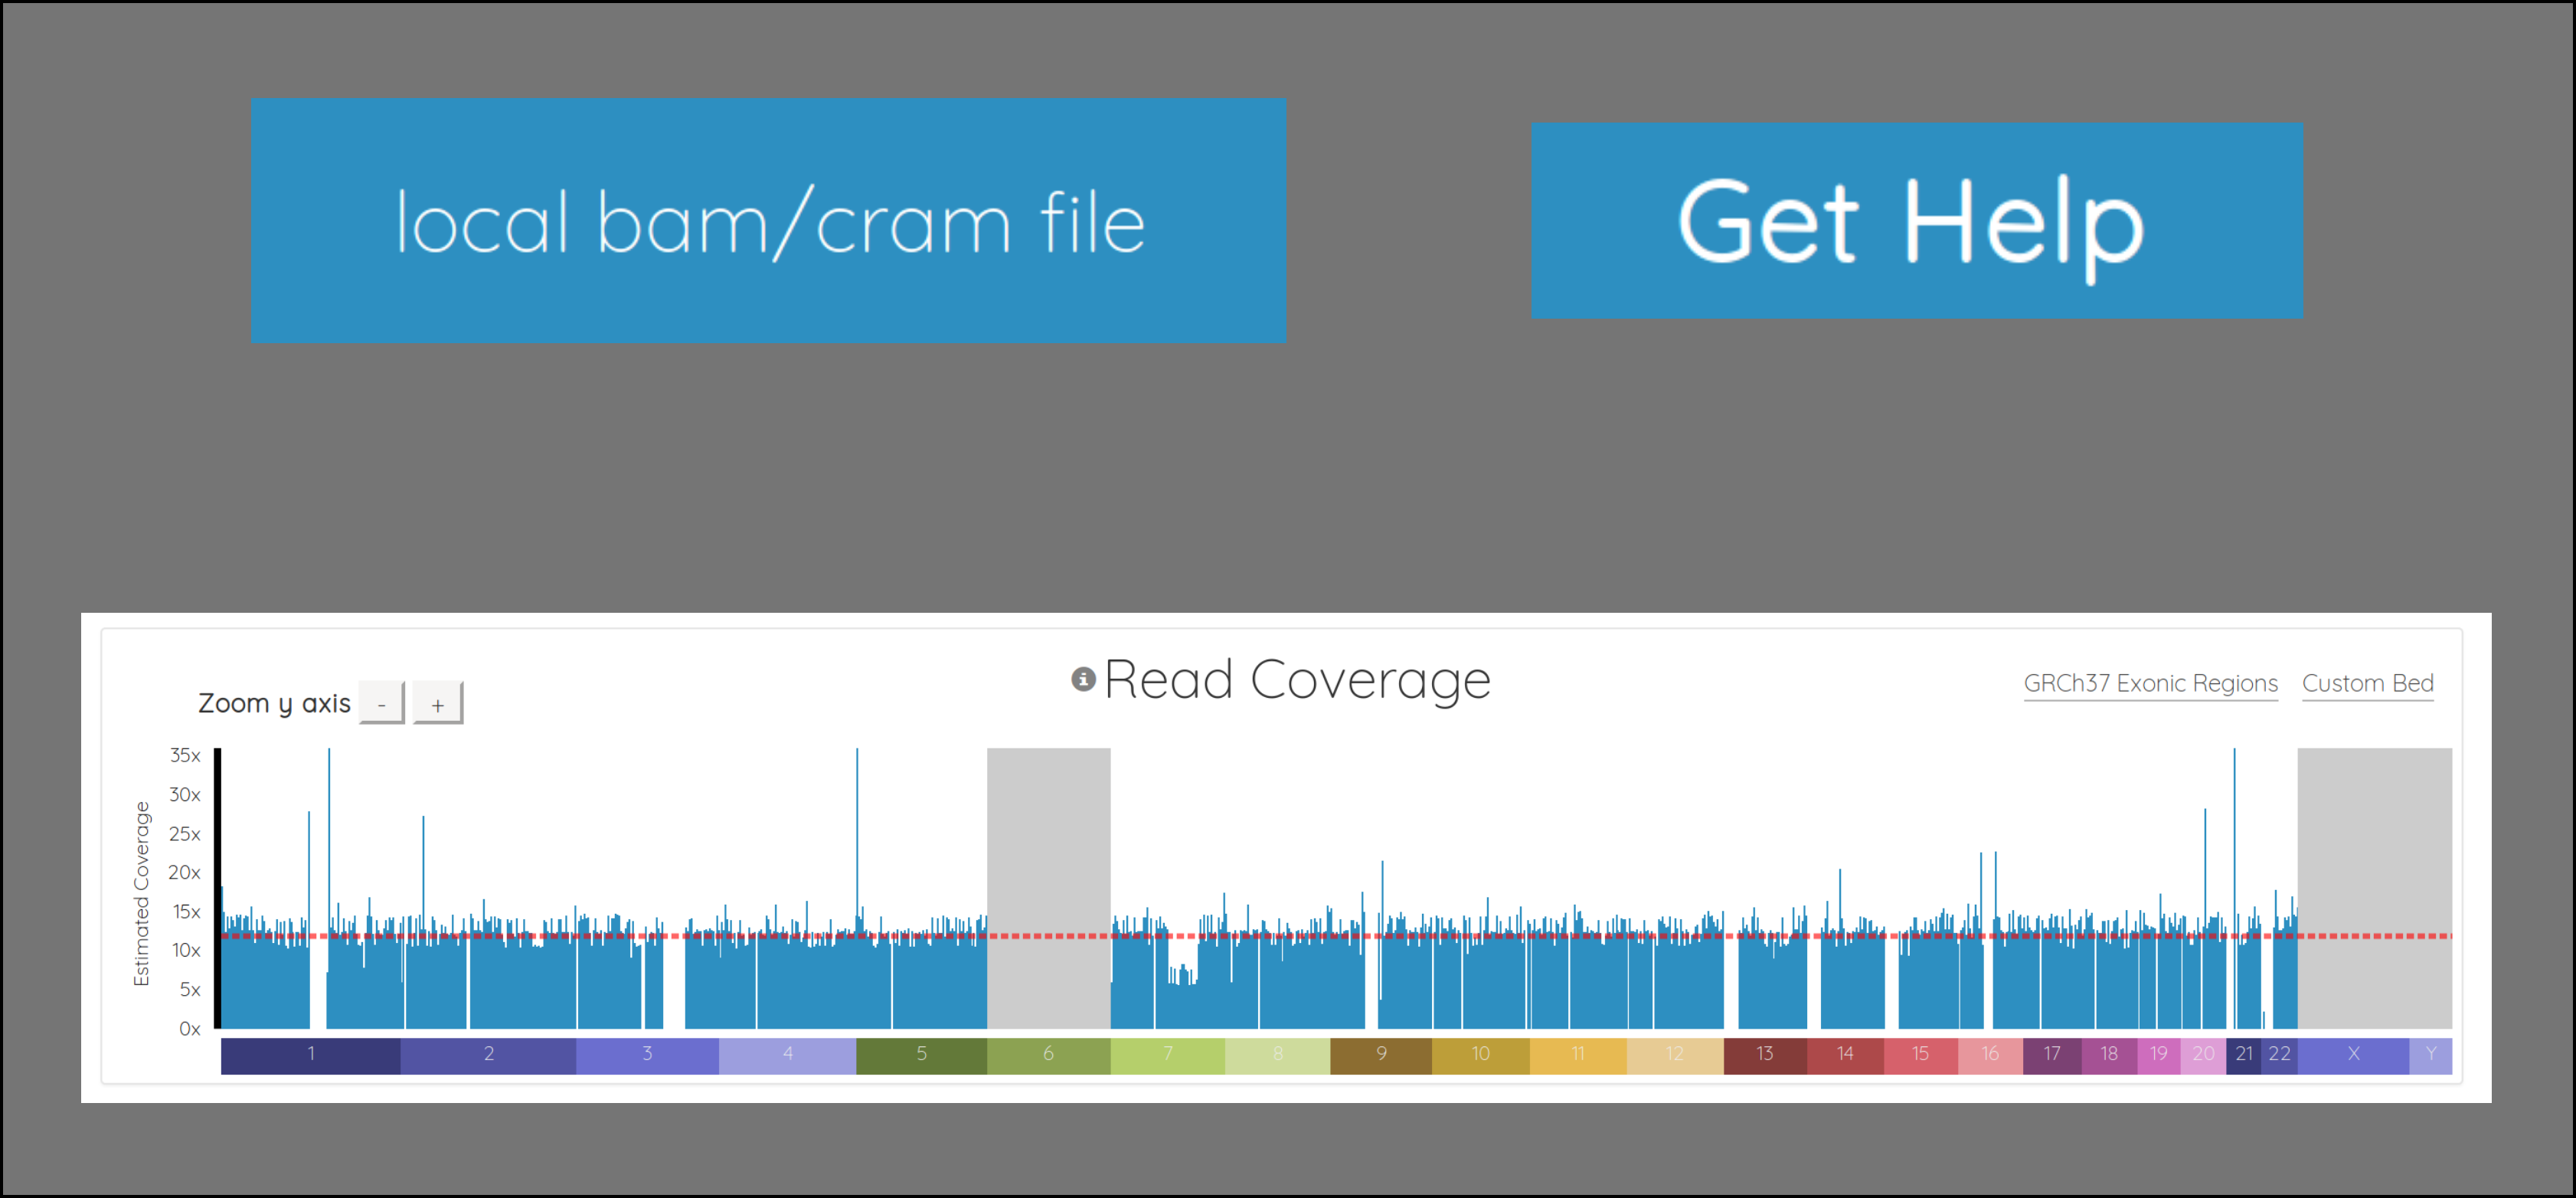
First of all, you’ll notice a “Get Help” button in the top right of the app, on the navigation bar.
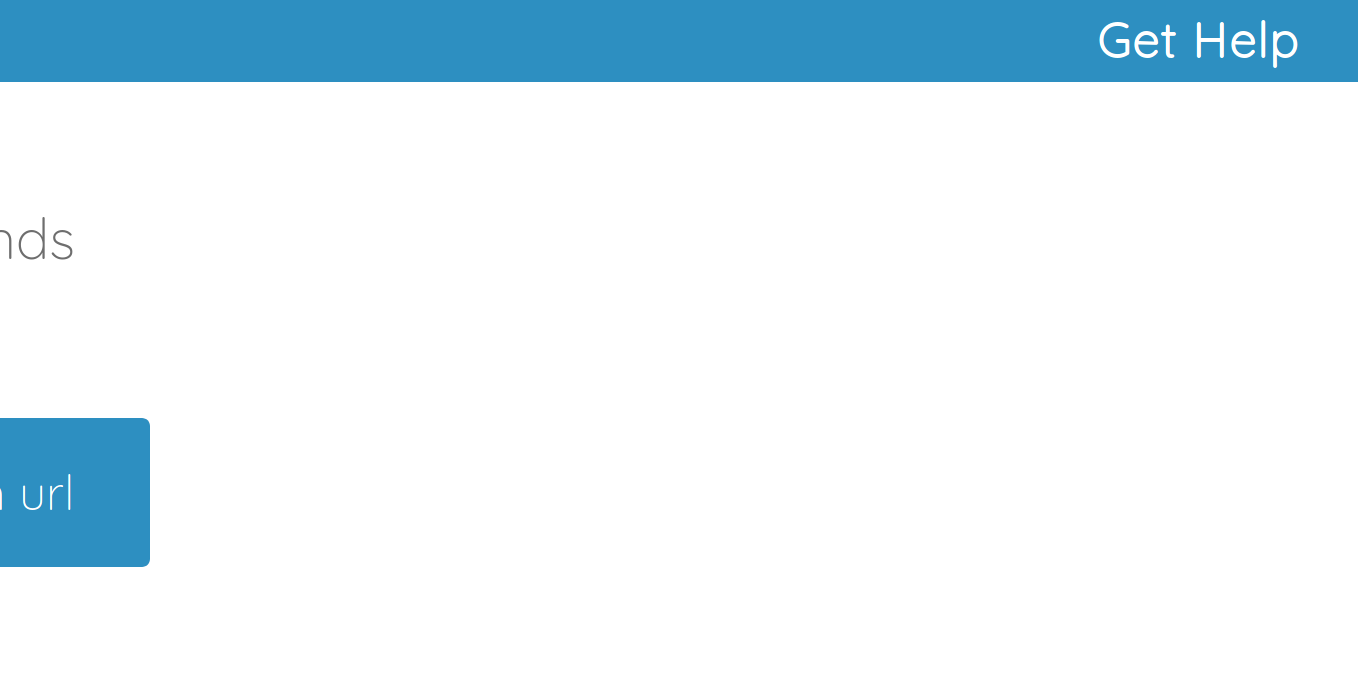
This button takes you to the brand new help page.
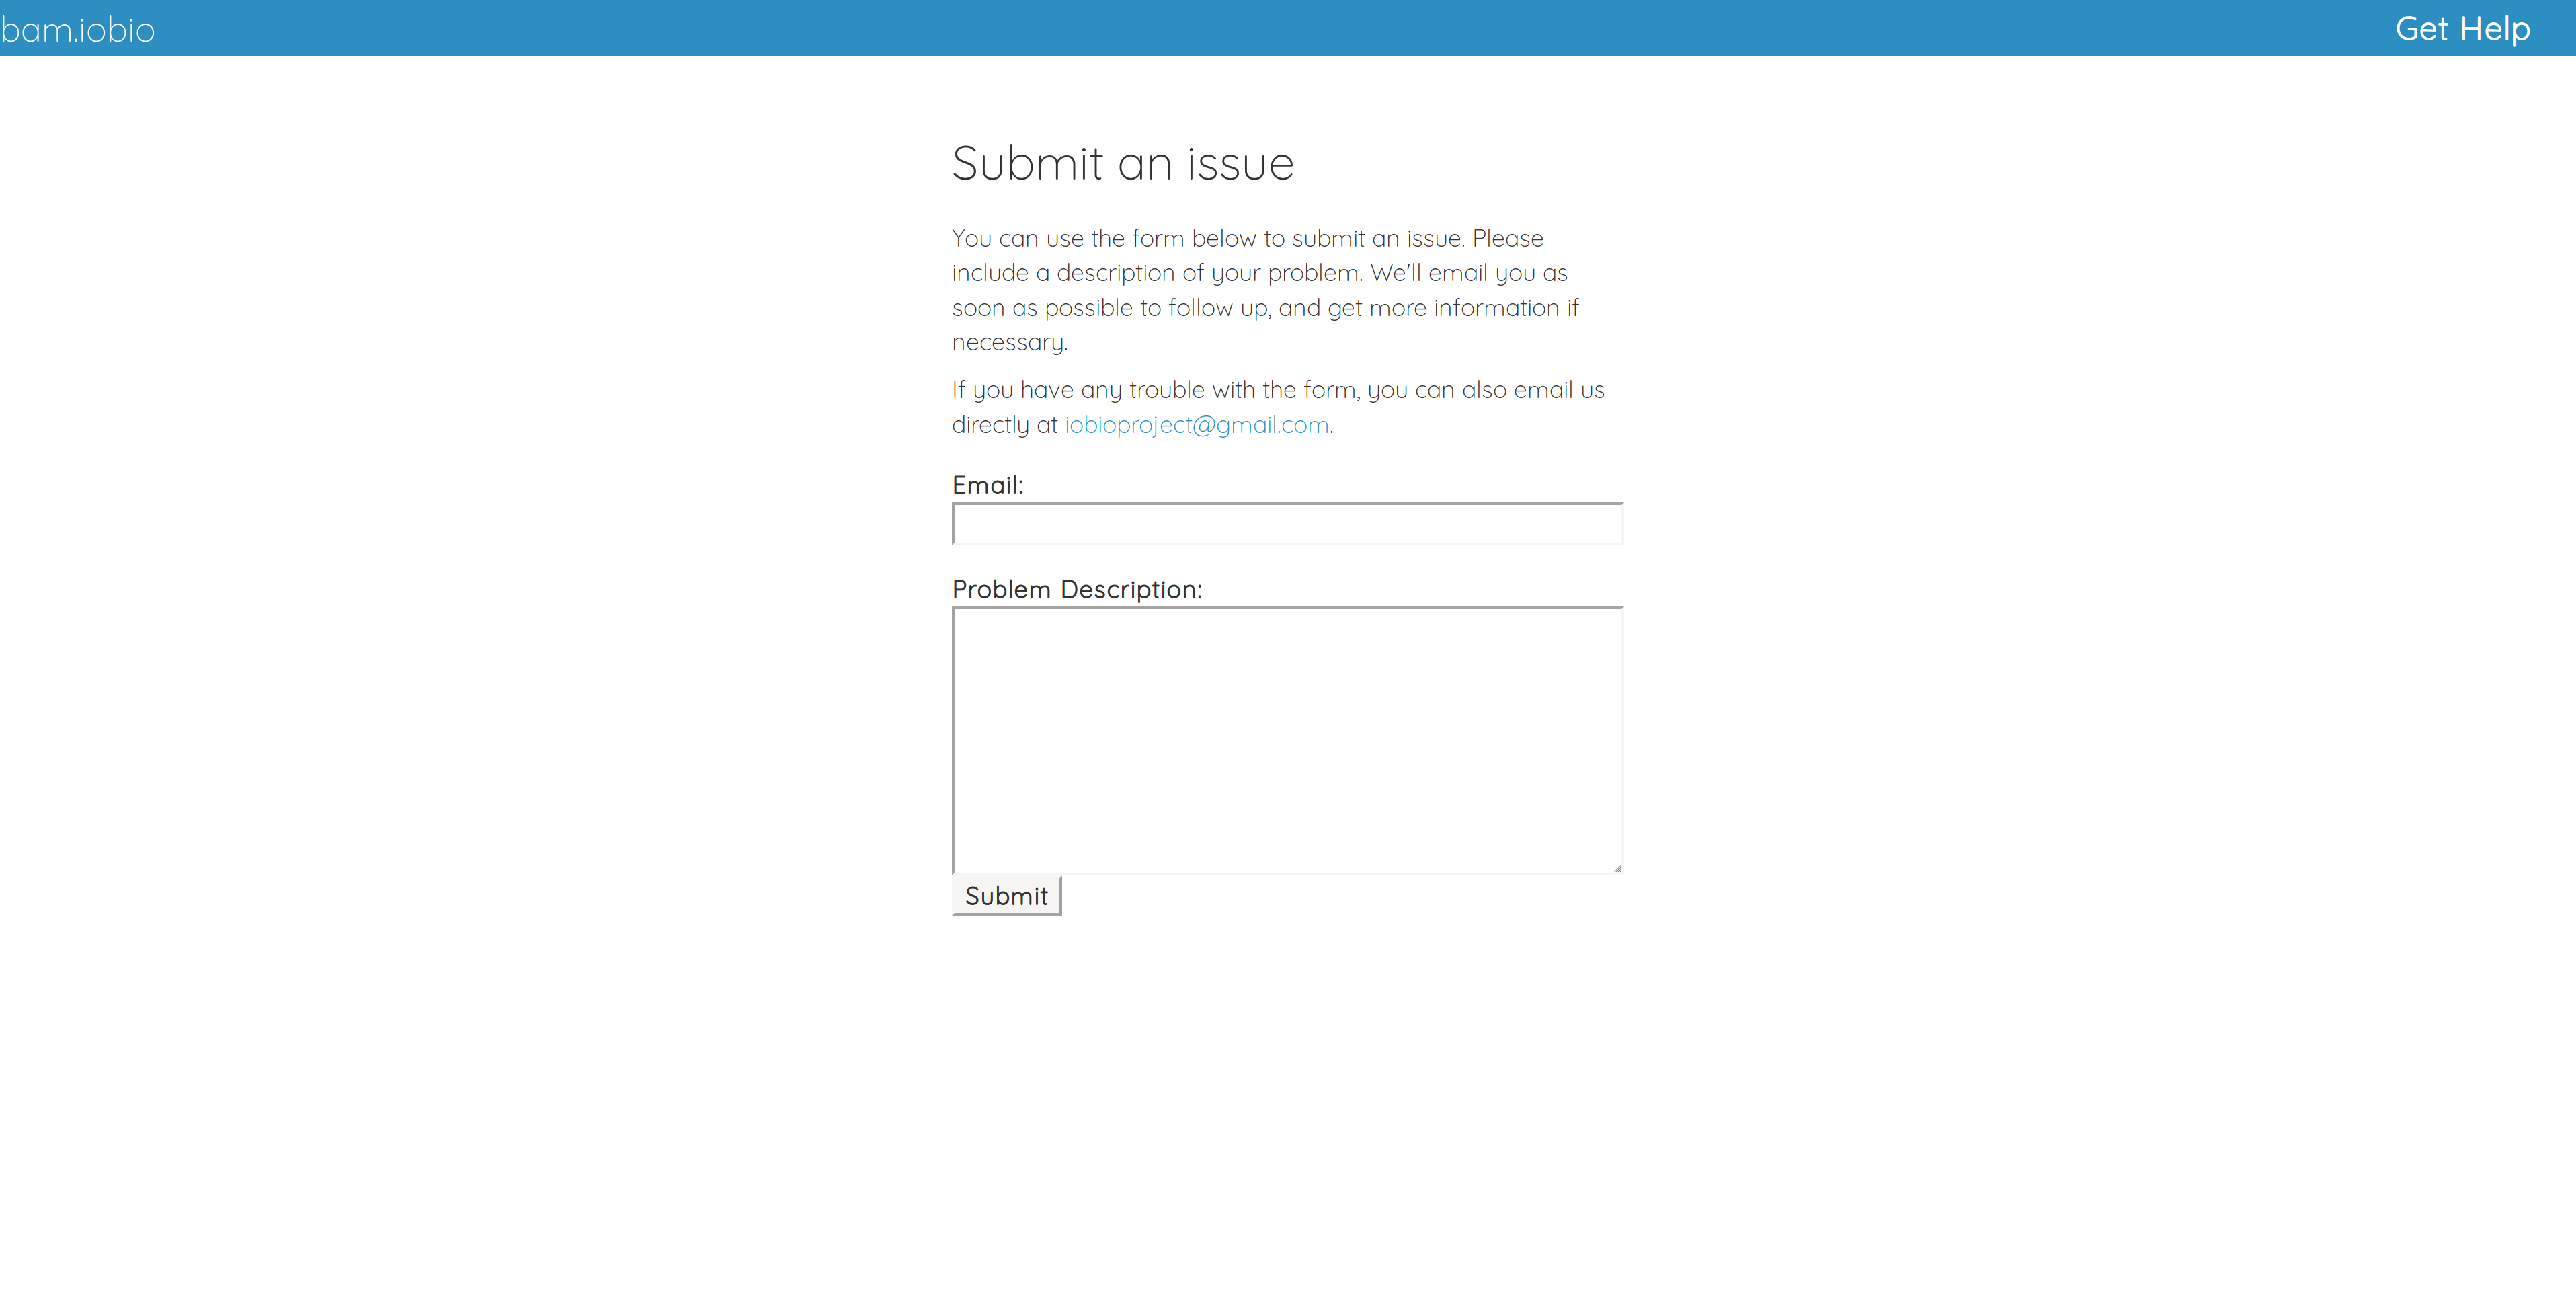
The purpose of this page is to provide a way for users to report issues without requiring any sort of account registration. Only an email address is necessary. We hope that having a simple and direct line to the developers will help our users resolve issues and make the experience better overall.
Local CRAM Support
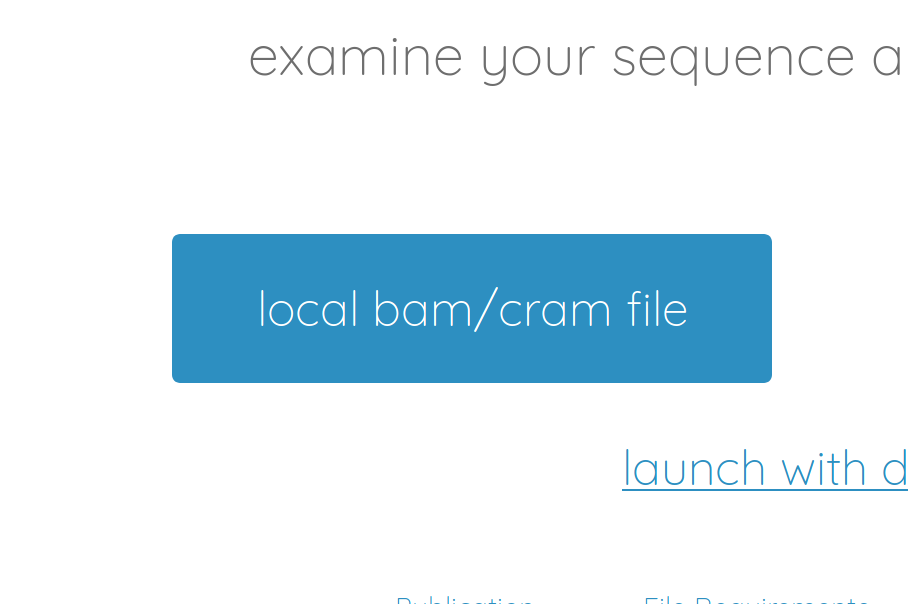
bam.iobio has supported loading CRAMs via url for a while now. However, when loading files from your local hard drive, only BAM was supported. We architected a new system that not only simplifies the way we load BAMs, but also adds CRAMs as well.
Improved Read Coverage Chart
Although the read coverage chart has always been front-and-center in bam.iobio, it was somewhat barebones. That’s no longer the case. Here’s the old version:
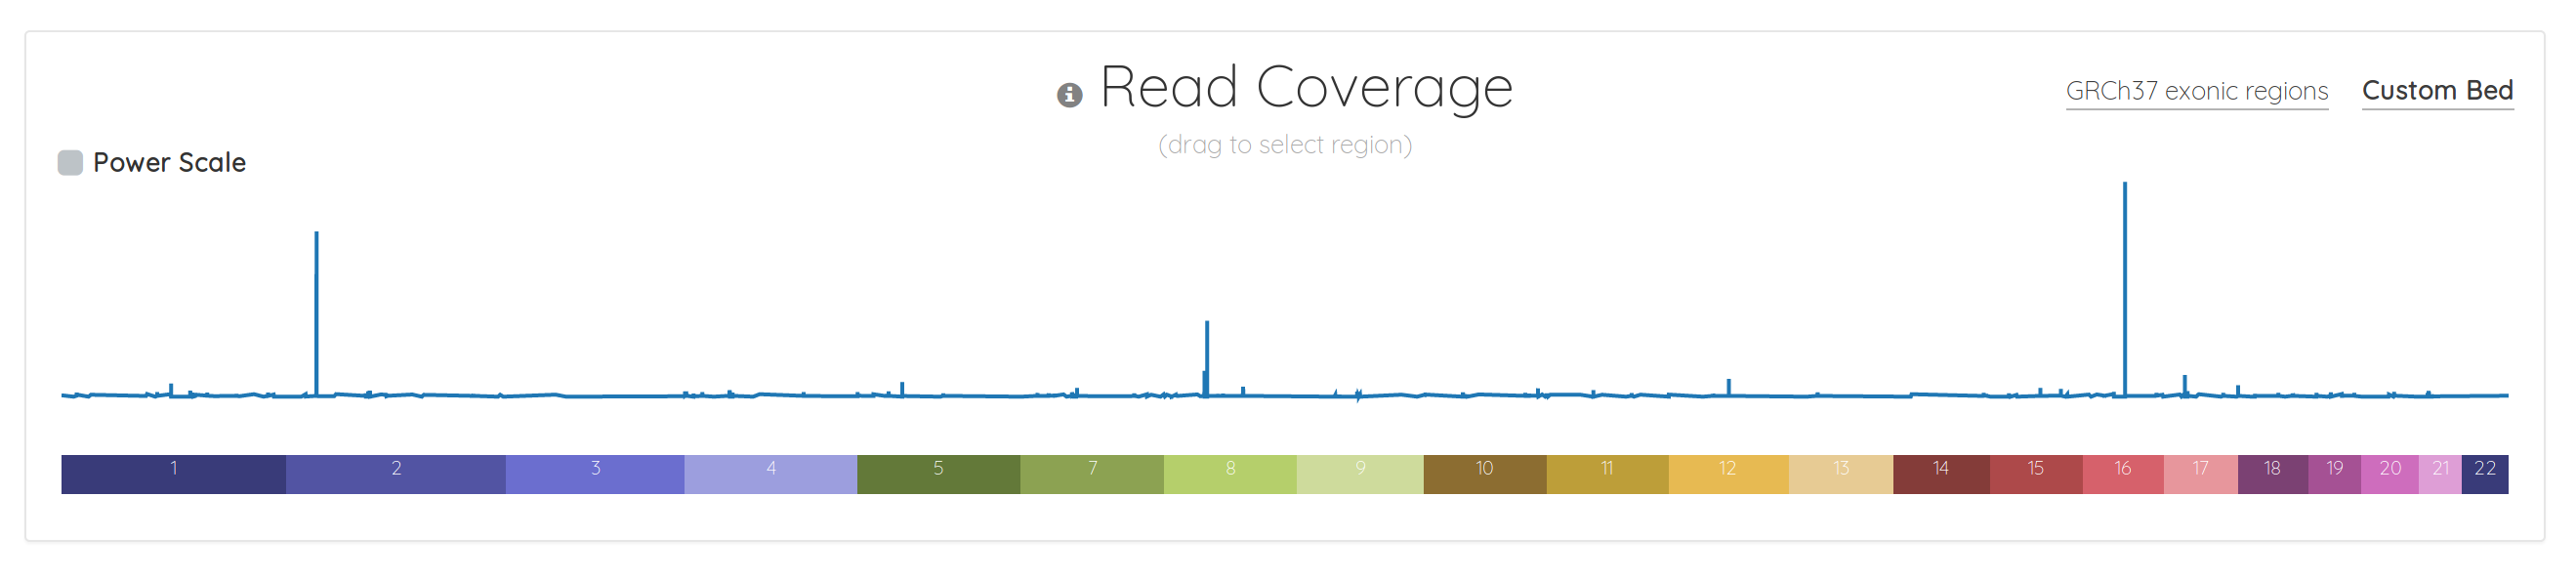
And here’s what what the same data looks like in the new version:
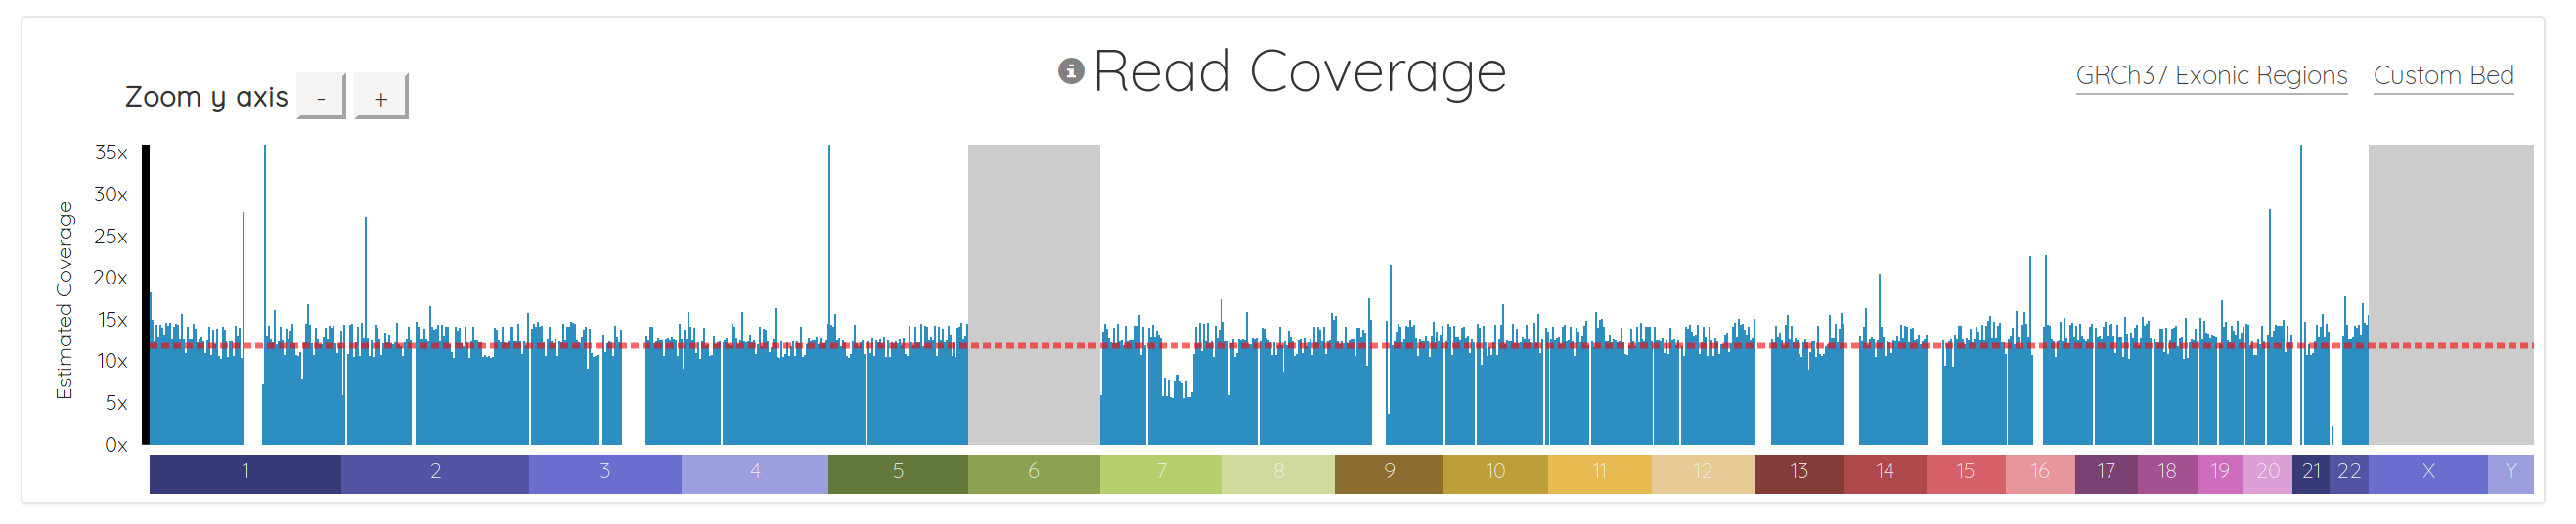
First, we added few nice visual cues for various situations. Chromosomes which are in the header but don’t have any reads are now grayed out, instead of just missing from the chart (ie chromosomes 6, X, and Y above). The chromosomes also render as the data streams in, so you don’t have to wait for everything to download before seeing some results.
We added a horizontal line indicating the average coverage, as well as y-axis labels showing approximate coverage values, and buttons for zooming the y-axis.
Importantly, we also fundamentally changed the way the chart is drawn. It used to be a line chart, which sometimes made it difficult to interpret, depending on the data. It’s now essentially a bar chart with many small bars. This makes it much easier to spot regions with 0 coverage, which show up naturally as gaps. It also makes it simple to see things like copy number variations (CNVs), as demonstrated in chromosome 7 below. Notice how the region to the right of center has 1/2 the coverage, indicating a likely CNV here:
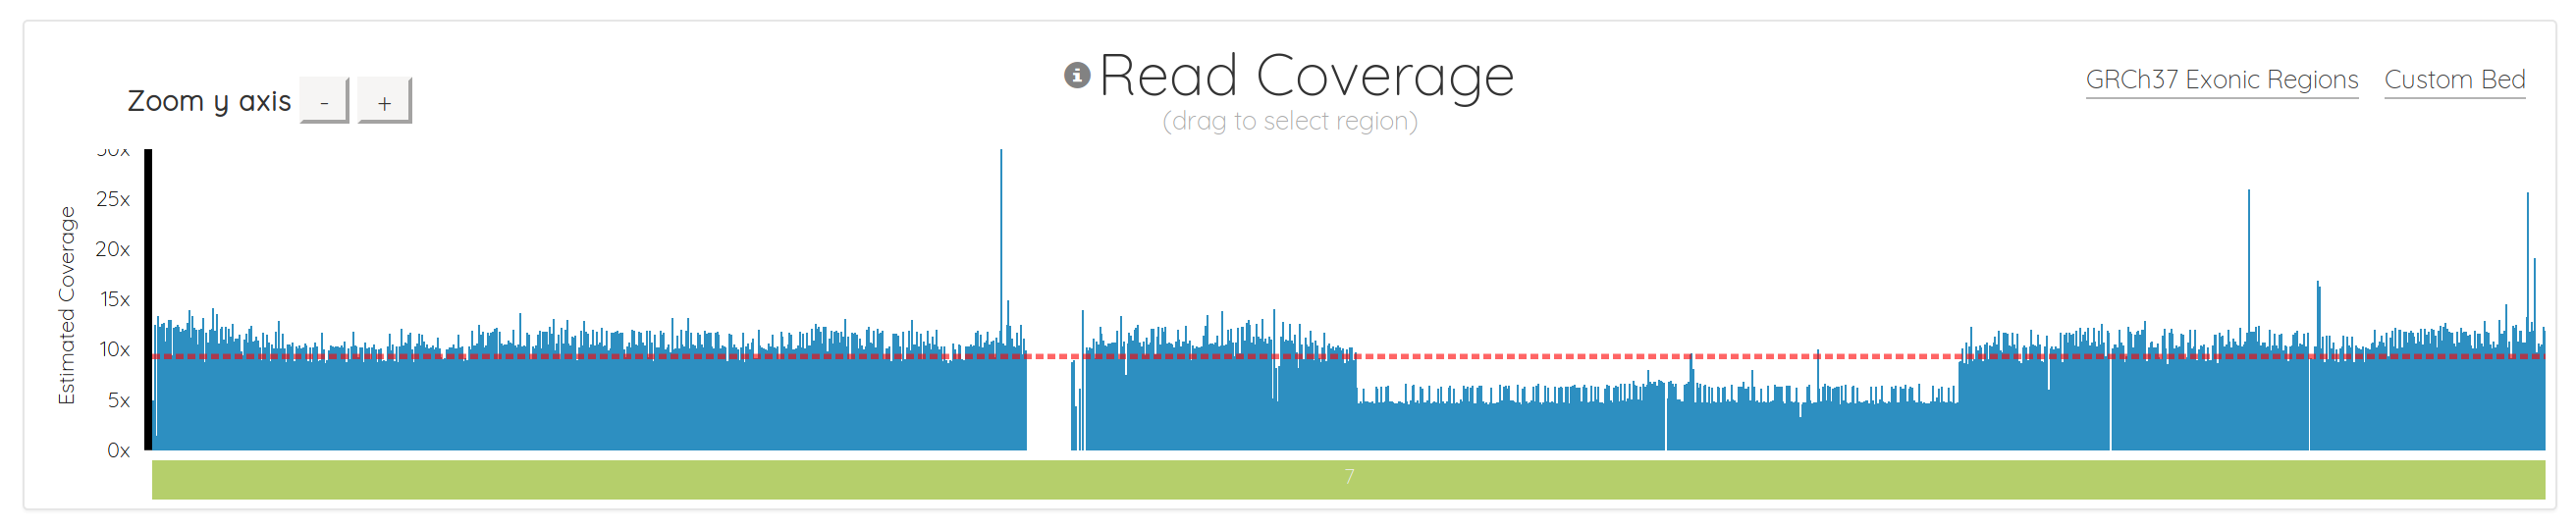
The new bam.iobio has already started rolling out. The process is set to complete over the next few days. If you use bam.iobio and haven’t been switched over yet, you should be soon. We hope you like the new features. If you run into any problems, please use the help page to get in touch with us!