We are pleased to release a new, unique web app, taxonomer.iobio, for real-time interactive analysis of metagenomic data, based on the methods published today in a paper in Genome Biology. Taxonomer.iobio is the result of what has been a really fun and productive collaboration between the Taxonomer team (the laboratories of Mark Yandell, Robert Schlaberg, and Karen Eilbeck) developing a super fast and accurate taxonomic DNA read classification software, and the iobio team in the laboratory of Gabor Marth turning it into an intuitive and interactive web analysis tool. Taxonomer has a very wide application area, including clinical diagnostics (see press release from the ARUP Reference Diagnostic Laboratory). Here we focus on the web app that can be used as a "microscope" for essentially all types of DNA or RNA sequencing datasets.
In a nutshell, users of this tool need to specify (but not upload!) a FASTA or FASTQ format sequence file containing either RNA-Seq gene expression data or the output of a DNA sequencing experiment. Taxonmer.iobio streams the first several thousand sequencing reads to Taxonomer which quickly classifies the reads, and returns the results to the analysis app where it is visualized. It should only take a few seconds to see the gross biological composition of your data, after which you can dig down into each kingdom (e.g. bacteria, viruses, fungi) to see higher-resolution classification, sometimes down to the species or even strain level.
Intro
First a quick intro to the different parts of taxonomer.iobio.
Data Overview
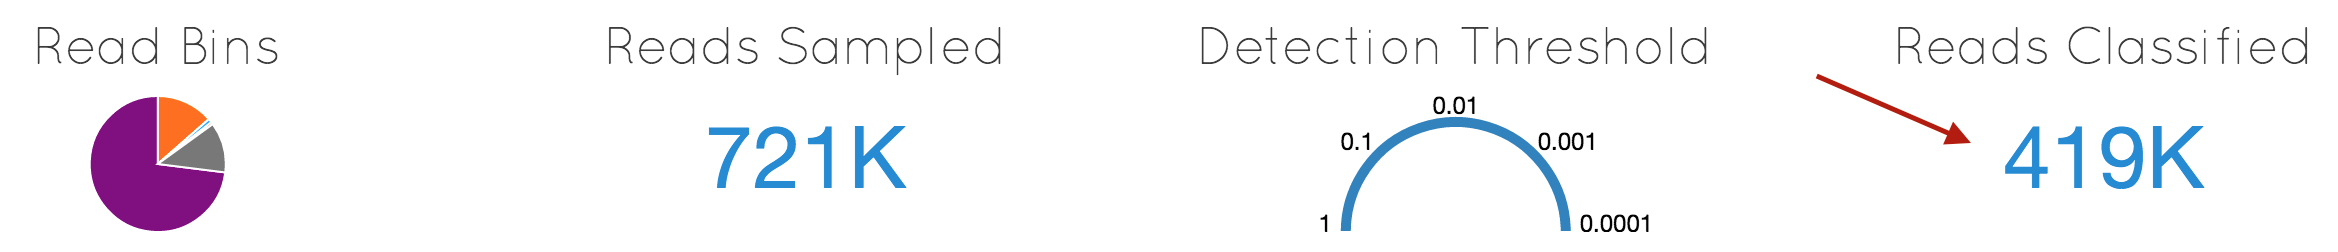
Taxonomer analyzes the incoming read data in two steps: (1) a binner step, which is shown as a pie chart and (2) a classifier step, which is shown as a sunburst chart. The number of reads that are classified are shown in the data overview panel (red arrow below). More information regarding why some reads are not classified can be found in the paper.
Binner Pie Chart
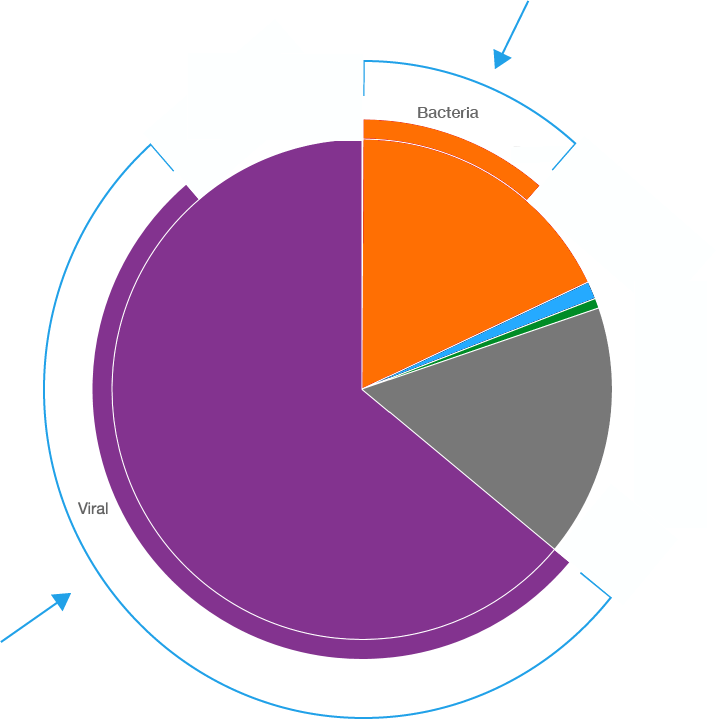
Taxonomer first quickly identifies each read as being in one of the following bins Human, Bacterial, Viral, Phage, Fungal, PhiX, Ambiguous, or Unknown. Ambiguous is for reads that fit into 2 or more bins and unknown is for reads that do not fit into any bin. The pie chart below has two parts: (1) the traditional pie chart displays the binner information and (2) the outer edge of the pie chart (blue arrow) displays the subset of the binned reads that could be further classified. In the pie chart below only bacterial and viral reads could be further classified.
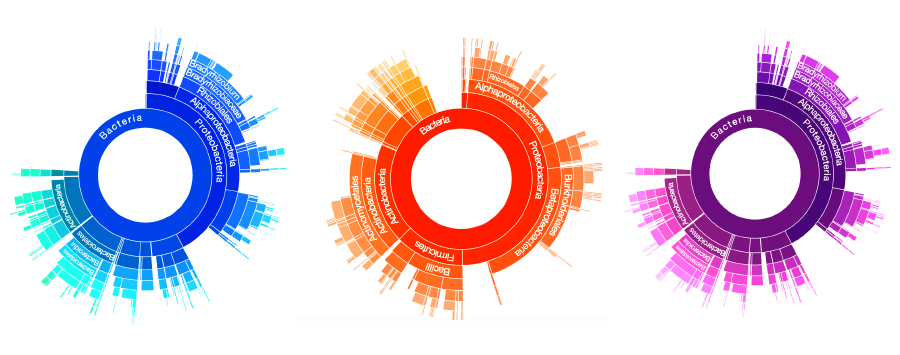
Classifier Sunburst
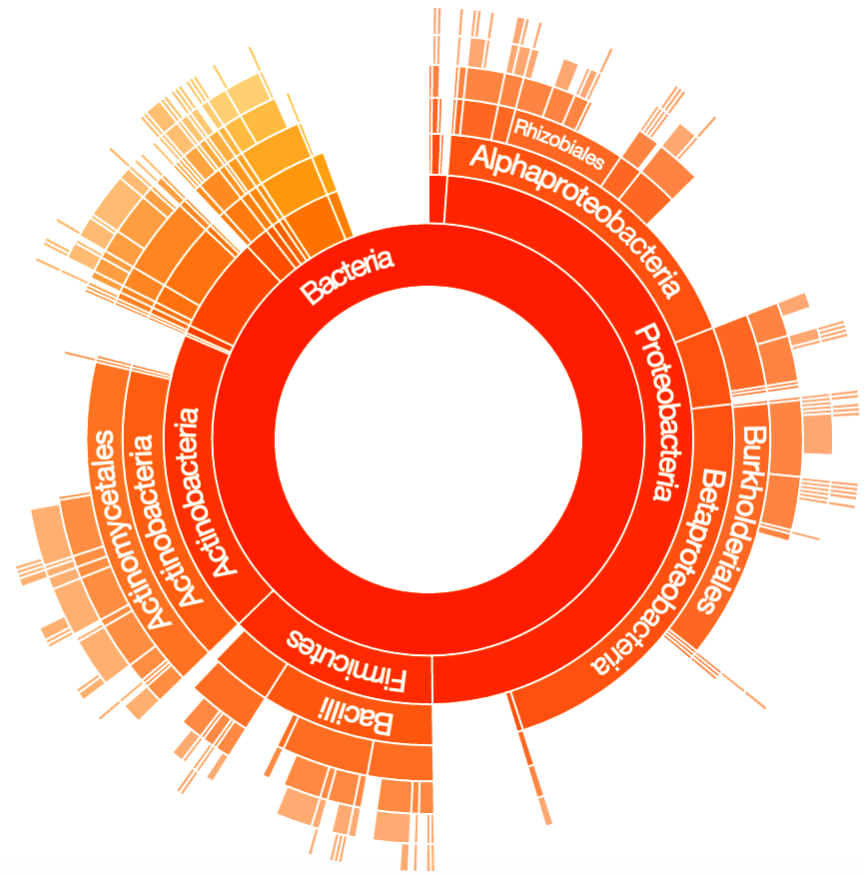
After binning, Taxonomer proceeds to more finely classify the reads. This could result in a read being classified into a particular phylum or even into a particular species, if sufficiently unique. For example, the Sunburst below goes from a broader classification of Bacteria Kingdom in the middle to a finer classification along the edges. Additionally, the size of each arc in the sunburst contains all the reads that classified to that specific arc and its children arcs. For example, the Class Alphaproteobacteria in the sunburst below contains all the reads that can be classified to the Alphaproteobacteria, regardless of whether those reads can be more finely classified (e.g. Order Rhizobiales).
A few good features
Just a few things worth pointing out.
Easy sharing
One of the nice things about working with data as URLs and public databases is that all analyses can be easily shared. Simply copy and paste the URL in the browser bar and the analysis can be shared with anyone! We think easy sharing is really important for open science, so try to include it in all our apps.
Full SRA and ENA Database Support
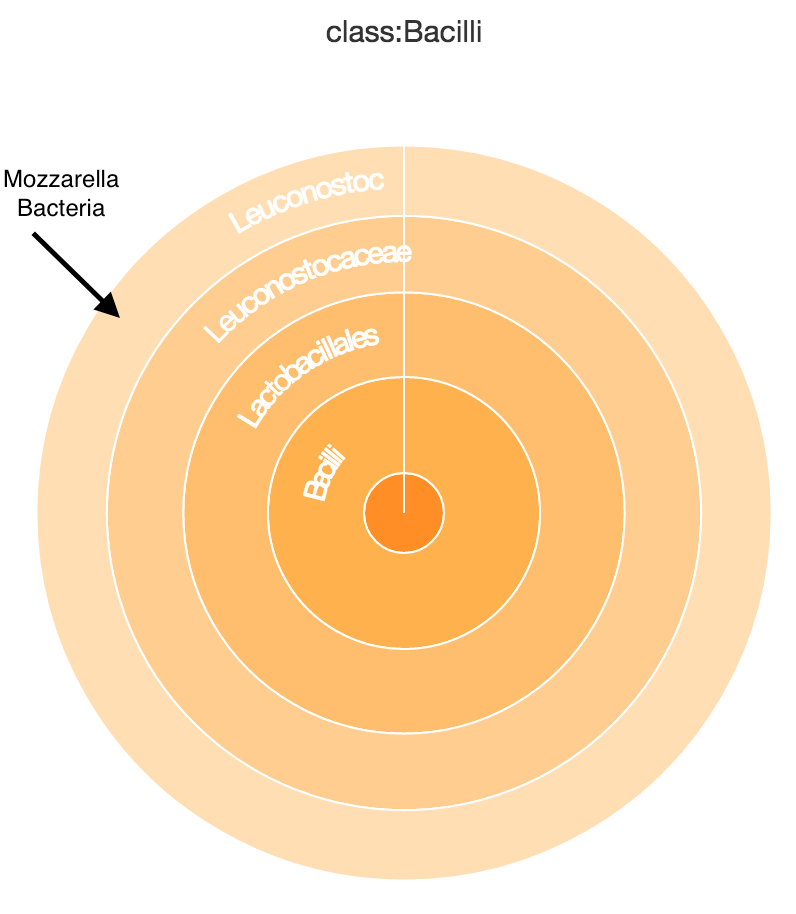
The SRA database can be accessed easily via their SRAtool kit, so we added support to analyze any sample as long as you know its SRR, DRR, or ERR accession id. This is a lot of fun when paired with cool datasets like the Pathomap Project, which swabbed and sequenced a bunch of areas around the NYC Subway system. Here is a bench in central park that you can find some bacteria used in culturing mozzarella, so you know people are eating their lunch there! To see the bacteria you have to zoom into All ->Bacteria ->Firmicutes ->Bacilli ->Lactobacillales. Of course if you look at the viral sequence found on the same bench it may make you rethink if you would want to eat your lunch there.
We also fully support ENA, the EBI Nuceotid Archive. Since ENA supplies http links to their raw fastq files, we can analyze ENA data without without any extra effort. And here's a human sequencing data sample and you can quickly see that there is a little contamination example in taxonomer.iobio.